Balti and Bioinformatics: 14th November 2019
14 Oct 2019
Indian food in Birmingham is some of the best in the UK - but that’s not to say every Indian restaurant is good, in fact far from it. The selection can be broadly divided into three categories: cheap eats (less than a tenner/head), mid-range (10-30/head) and high end (more than 30/head):
Convenient for the University is Vaibhavam South Indian, under new management from when it was called Dosa Mania (and also good). Specialising in South Indian cuisine the masala dosa is always a good and cheap option for a filling lunch. If going for dinner, throw in some curries such as the chettinad style dishes. Even closer to the University is Amaa Dosa, rather unpreprocessingly located at the back of the old Costcutter supermarket on the Bristol Road. Service is pretty patchy but the curries are tasty (can also Deliveroo).
Grill pubs can be also be cheap and delicious: my friends recommend The Grove in Handsworth.
Finally if you are catering a meeting you can’t do better than getting a box of mixed samosas from one of the Indian sweet centres around Bearwood and Smethwick: Chandigarh Sweet Centre and Punjabi Sweets and Curry House are great. Just give them a call an hour in advance and they’ll have the best samosas ready for you at a ridiculously cheap price.
Sadly, the restaurants in the Balti Triangle are just not good or reliable enough to warrant a recommendation here.
A bit of a hike but worth it for the excellent thalis is Raja Monkey Cafe, out in Hall Green, run by the Lasan group.
A great place if you are having a large gathering, e.g. 10 or more is Tipu Sultan in Moseley not far from the Cricket Ground. The curries and grills are both excellent and you won’t spend a fortune.
Pushkar and Praza by Pushkar are both reliable restaurants (also on Deliveroo) that are convenient for entertaining on the Hagley Road: don’t expect fireworks but solid Indian cooking and good service.
By far the place we go to most these days is Asha’s. It’s a huge restaurant and quite swanky and so you might assume the food isn’t great, but that’s not true. Some of the dishes are truly standout: the lamb biryani is stuffed full of saffron flavour, and we almost always order a whole tandoori lamb leg (tandoori raan).
Lasan used to be the most famous Indian restaurant in restaurant popularised by Aktar Islam - however he has now moved to Opheem and I’ve heard mixed things, but if you want to impress someone with high end Indian “fine dining” this is the place.
Some notes for posterity from a recent conversation I was having on Twitter:
Institute of Microbiology and Infection, School of Biosciences, University of Birmingham, B15 2TT
This is the author proof of a chapter for the upcoming textbook edited by Dave Deamer and Daniel Branton entitled: Nanopore Sequencing: An Introduction published by World Scientific. We are grateful to have been permitted to retain the copyright for our chapter and it is reproduced in full. Please consider requesting an inspection copy and purchasing the book for your course!
DNA extraction strategies for nanopore sequencing 1
Joshua Quick and Nicholas J. Loman 1
Choosing a DNA extraction strategy 4
Digestion with Proteinase K 12
The phenol-chloroform method 13
Input requirements for ultra-long reads 17
Quality control of DNA samples 18
Size-selection with SPRI beads 22
Buffer exchange with SPRI beads 23
Size selection by gel electrophoresis 23
As far as we can tell, read lengths in nanopore sequencing are dependent on the library preparation rather than any limitation of the sequencing chemistry. Long reads are useful for many applications but in particular de novo assembly. This is because long reads span repeats in the genome resulting in longer assembled contiguous sequences (contigs) [1]. The longest reads generated using nanopore sequencing now exceed 1 megabase pairs in length (1.2 Mbp at time of publishing[2]), but even longer reads will likely be achievable with further improvements in DNA extraction and library preparation methods. Such long reads will be extremely helpful in order to assemble difficult regions of the genome such as eukaryotic centromeres and telomeres. It may even be possible one day to sequence entire bacterial chromosomes or even eukaryotic chromosomes in a single read! Possibly the only limit to read length is the rate of naturally occurring single strand breaks in DNA.
This chapter will discuss the most useful extraction techniques for nanopore sequencing focusing on best practices for routine work, experimental design and quality control. Finally we will discuss ongoing efforts to generate ‘ultra-long reads’.
While it may be tempting to always pick a strategy to optimise for high molecular weight DNA, this comes at a significant cost in terms of time and labour (Figure 1). Sample input, read length and cost are all highly interdependent factors and designing a good experiment first requires an understanding of how these relate. If the goal is to assemble a bacterial genome (for example, to produce a reference sequence), we know that obtaining reads above the ‘golden threshold’ of 7 kilobases (the length of the ribosomal RNA operon) will in most cases result in a finished genome (meaning circularised with no gaps)[3]. The importance of the ribosomal RNA coding is that it is typically the longest repetitive region in a bacterial genome, so having reads longer than this threshold will enable these repeats to be ‘anchored’ to unique parts of the genome, permitting their assembly. Therefore, for many bacterial genomes, a simple spin column extraction (yielding typically up to 60 kilobase fragments) would be appropriate as fragment sizes will be sufficient to generate the read length required.
If, however, you are sequencing a complex metagenome with a mix of closely related species or strains (an extremely challenging assembly problem), then longer reads will be important for strain reconstruction using assembly. Similarly, complex genomes such as the human genome will benefit from the longest possible reads due to long repeats such as the in the centromeres, some of which still remain largely unassembled 15 years after the announcement of the first human reference genome. In these cases, cellular material is not limited so it is reasonable to attempt a high molecular weight DNA extraction.
Other applications may be limited by input quantity. Many clinical and environmental samples have intrinsically low biomass and therefore, in order to extract sufficient DNA for sequencing, these will need to be extracted with high recovery efficiency methods such as magnetic beads or spin columns. An understanding of the biological question at hand, and the limitations of the sample type available are therefore key to designing a good sequencing experiment.
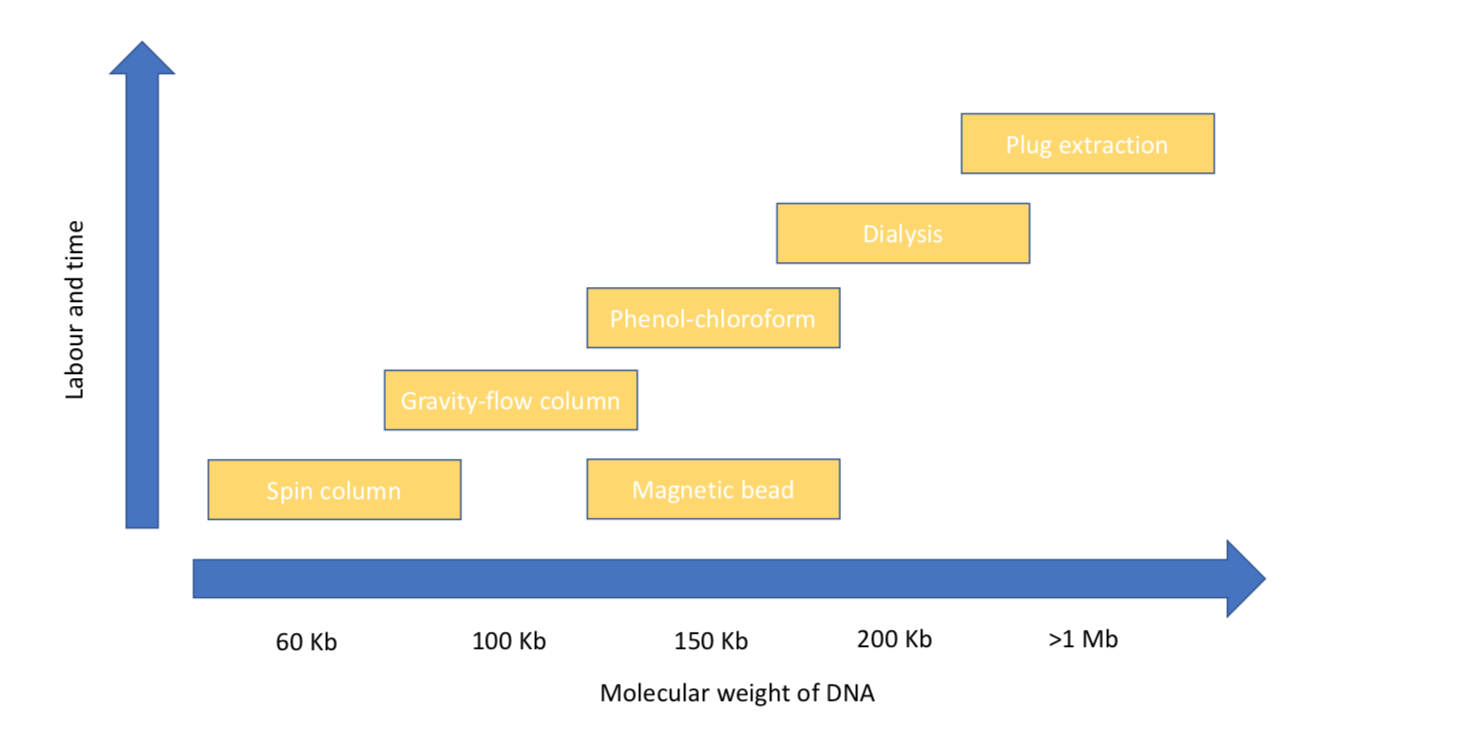
Figure 1. Showing the approximate average size of DNA fragments isolated by different methods discussed in this chapter.
Hundreds of DNA extraction methods have been described in the literature. Often they have been developed for specific cell or samples types, however they will usually share some common steps: cell lysis, purification and elution/precipitation. Here we will describe some of the routine methods used in DNA extraction.
The simplest way to get started is to use a DNA extraction kit. These kits offer a high level of consistency and excel for low-input sample types. They are however more expensive than manual methods typically costing around $5 per sample and fragment length will be limited to around 60 Kb.
This is the most common type of DNA extraction kit you will encounter in a laboratory. Spin columns are so called because reagents are added to the top of the tube then forced through the binding matrix when spun in a centrifuge. In some cases, columns include cell lysis reagents. Binding DNA, washing and eluting the DNA can be done rapidly in this way, with the whole process taking around an hour. In addition, you can perform many extractions in parallel, by using more positions in the centrifuge rotor. Spin columns are based on chemistry developed in 1990s[4, 5] using either silica or anion exchange resins to reversibly bind DNA allowing them to be separated from cellular proteins and polysaccharides.
It is worth understanding how spin columns work to understand why they are so effective at purifying and recovering DNA from a wide range of samples, but also their weaknesses. Most kits use high concentrations of guanidiunium hydrochloride in the lysis buffer[6]. Guanidiunium hydrochloride is a chaotropic agent that disrupts the hydrophobic interactions between water and other molecules. This is a good choice because it both lyses cells by denaturing membrane proteins and precipitates DNA by disrupting it’s hydration shell which maintains its solubility in aqueous conditions. Under these conditions DNA binds to the binding matrix in the column allowing proteins and other contaminants pass through. The DNA bound to the silica resin membrane can be washed using 70% ethanol to remove contaminating proteins and salts, including the lysis buffer itself. DNA is eluted off the column by adding a low ionic concentration buffer such as 10 mM Tris and incubating for a few minutes. The DNA resolubilizes in the aqueous solution and the purified DNA is eluted from the column by centrifugation. DNA is sheared during binding and elution due to the large physical forces experienced during centrifugation and is forced through the porous resin.
For common Gram-negative bacteria (such as E. coli) >60 Kb can be extracted using a kit with spin-column extraction in less than 30 minutes. Spin columns have a binding capacity of about 5-10 µg and can be run in batches, making them suitable for extracting large numbers of samples.
Gravity flow columns (a common example is the Qiagen genomic-tip) [7] employ the same binding technology as spin columns but they come in larger sizes, the largest of which has a binding capacity of 500 µg (500G tip, also known as a ‘MaxiPrep’). These are not placed in the centrifuge but left in a rack allowing the lysate/wash solutions to drip though by gravity. These can be used to recover DNA with an average size of 100-200 Kb due to the gentle handling of the sample but are much slower. Unlike spin columns however, DNA is eluted from the column in a large volume then precipitated with isopropanol to concentrate it. DNA produced using this method should be higher quality than that produced using a spin column. They are especially useful for isolating large quantities of DNA and maybe an appropriate choice for many nanopore applications.
Magnetic beads have many uses in molecular biology as they can be made with a wide variety of functional groups on the surface[8, 9]. Beads used for isolation of genomic DNA are uniform polystyrene and magnetite microspheres with a carboxyl coating. In the presence of a chaotropic agents DNA transitions from solution to a condensed ‘ball-like’ state in which it is attracted to the beads[10]. This allows the DNA to purified by washing with ethanol before being eluted by placing in a low ionic-strength solution. The negative charges of the carboxyl groups help to repel the similarly charged DNA off the beads. The main advantage to using magnetic beads is speed of processing as DNA binding occurs very quickly in solution. Such techniques are also amenable to automated handling are used in many commercial high throughput robot platforms.
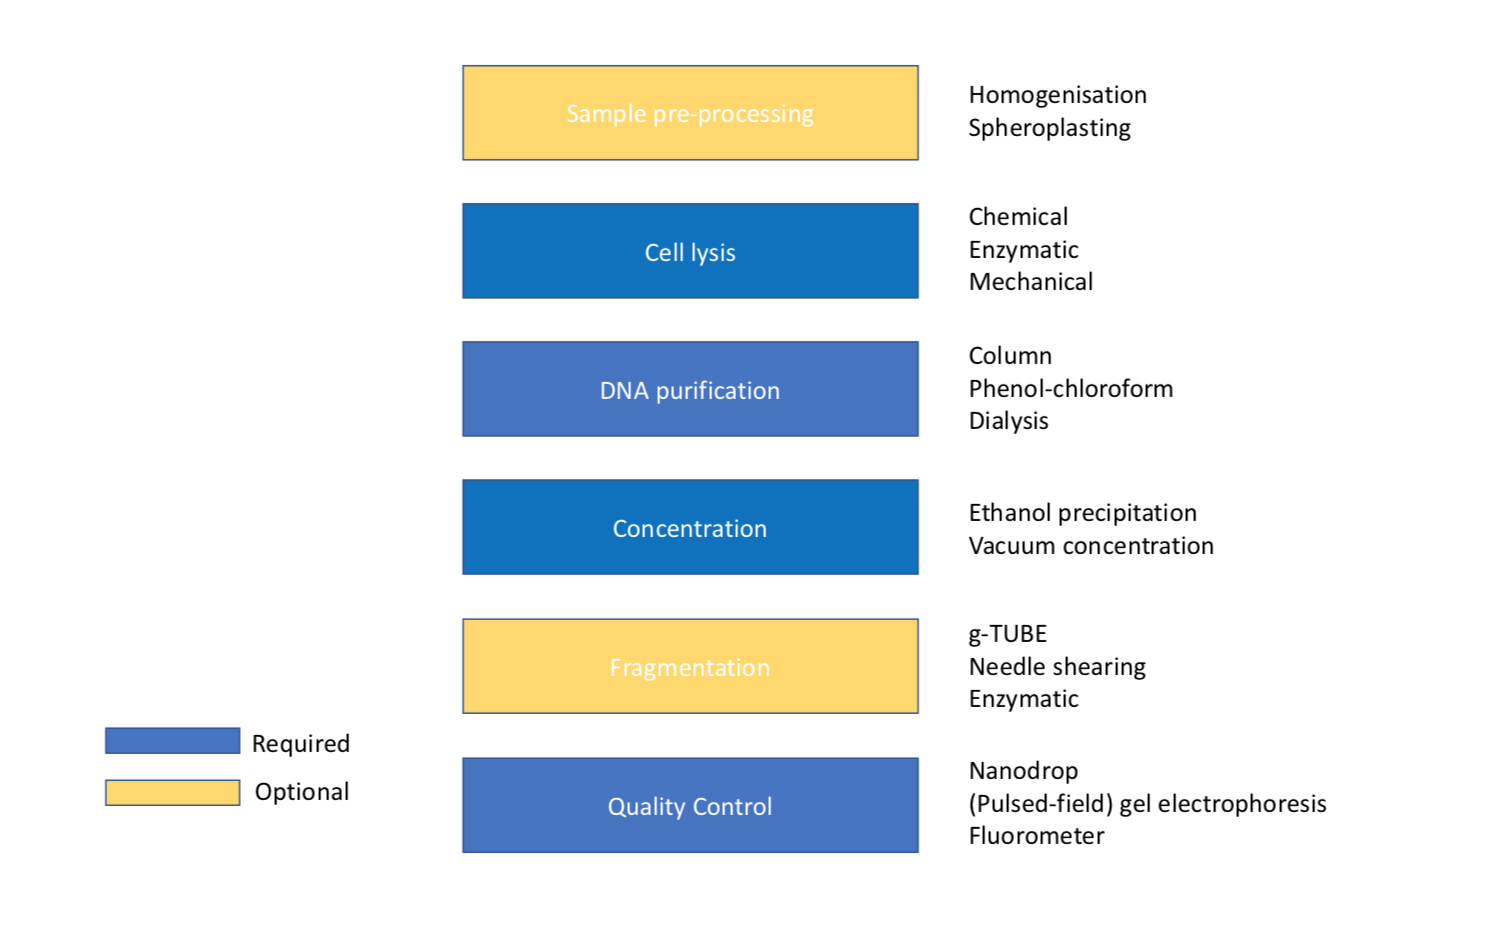
Figure 2. Figure showing the order of steps required for DNA extraction with optional sample pre-processing and fragmentation.
Certain sample types, particularly plant and animal tissue, must be ground up before lysis in a process called homogenization to increase the surface area for cell lysis. This is usually done by freezing with liquid nitrogen then grinding in a Dounce homogenizer or pestle and mortar[11]. The liquid nitrogen has a dual purpose of making the sample very brittle for efficient grinding but also inhibits nuclease activity which would degrade DNA.
Spheroplasting is the process of digesting away the cell wall while keeping the cell intact by keeping the cells in sucrose buffer to protect them from osmotic shock[12]. The name spheroplast derives from the spherical appearance of cells after cell wall digestion due to the membrane pressure. This process allows cells to be easily lysed by the addition of detergent even from cells with thick cells walls such as yeast.
Cell lysis is the process of breaking open cells to release DNA. This is usually performed by using detergents, enzymes or physical methods. Bacteria, yeast, plants and animals have very different cellular structure and therefore different lysis methods are employed. Commonly-used detergents include sodium dodecyl sulfate (SDS)[13] for bacterial and mammalian cells, and cetyltrimethylammonium bromide (CTAB) for plants[14]. Strong detergents like SDS also serve to protect DNA from degradation by inactivating nucleases. Many Gram-positive bacteria are too tough to lyse with detergents due to their peptidoglycan cell wall so lysis solutions may also incorporate additional enzymes. Lysozyme is an enzyme that breaks down the cell wall by catalyzing the hydrolysis of specific bonds in peptidoglycan. Specialist enzymes are used for Staphylococcus (lysostaphin) and Streptomyces (mutanolysin) where lysozyme is ineffective. Yeast cell walls are composed of two layers of ß-glucan which requires lyticase and zymolase to break it down. Some spore-forming bacteria and fungi may also have additional layers of peptidoglycan or chitin making them extremely resistant to enzymatic or chemical lysis so mechanical methods may be needed. The most common method is bead beating in which various sizes of ‘beads’ made from materials like glass or zirconium are vigorously shaken with the sample in a homogenizer disrupting tissues or smashing open cells. Bead beating is very effective at releasing DNA from cells however, due it’s vigorous nature it also causes a lot of DNA shearing making it unsuitable for isolating high molecular weight DNA. It may be necessary to refer to the literature to determine the most appropriate lysis method for your specific sample type.
Proteinase K is a serine protease which cleaves the peptide bonds in proteins. It is often added to lysis buffers as it is highly active in the presence of SDS[15], chaotropic salts and elevated temperature (50°C) which help unfold proteins making them more accessible for digestion. It is also useful for inactivating nucleases. These properties mean it is very useful for extracting high molecular weight DNA.
Phenol was used to purify nucleic acids by Kirby in 1956, first using it to isolate RNA[16] then DNA[17]. It is an organic compound that acts as a solvent for proteins and is able to separate them from DNA. Phenol is slightly water-soluble but has a higher specific gravity so a mixture of the two can be separated by centrifugation into two phases. Adding chloroform as an additional organic solvent helps prevent phenol carry-over as phenol is more soluble in chloroform than water. DNA with an average size of 150 Kb or even much larger can be isolated using the phenol-chloroform method if performed carefully, partly due to reduced physical forces employed compared to column-based techniques [18]. It is also very effective at removing nucleases. This method was once the standard approach for DNA extraction but has largely fallen out of favor: partly due to its toxicity (it requires special handling procedures) as well as the easy availability of column-based methods. However, this approach is now seeing a resurgence for nanopore sequencing due to its effectiveness in generating long fragments, we have generated read datasets with an N50 of >100kb and with maximum read length of >1 megabase using this method [2].
To perform phenol-chloroform purification, an equal volume of phenol or phenol-chloroform is added to the aqueous solution of lysed cells. These are mixed on a rotator until a fine emulsion forms. After centrifugation the two phases separate, the aqueous phase on top and the denser organic phase below. At pH 8.0 DNA and RNA partition into the aqueous phase whereas proteins move into the organic phase purifying the DNA. Between them a white precipitate of proteins and usually forms which is known as the interphase. This process is often repeated a few times to ensure the complete removal of proteins before precipitating the DNA.
Following deproteinisation with phenol-chloroform, DNA can be purified and concentrated by ethanol precipitation. By adding salt and ethanol, DNA can be precipitated and washed before being re-suspended in a small volume. This allows high concentrations to be produced. Ethanol is much less polar than water and above a certain concentration it will disrupt the hydration shells surrounding the DNA. This allows the cations from the salt to form ionic bonds with the phosphates of the nucleic acids resulting in precipitation. A variety of salts can be used to provide the cations: sodium acetate or ammonium acetate are commonly used. If DNA precipitates in large enough quantities it appears out of the solution like a spider-web with bubbles trapped in it (an effect caused by the outgassing of ethanol). In some cases it can then be hooked out in one piece or ‘spooled’ on a glass rod[19]. If the quantity is insufficient or if it breaks up when spooled, it can be pelleted by spinning in a centrifuge. In both cases the DNA needs to be thoroughly washed in 70% ethanol to remove residual salts before being resuspended in a low ionic concentration buffer ideally at pH at 8.0 (see storage of HMW DNA).
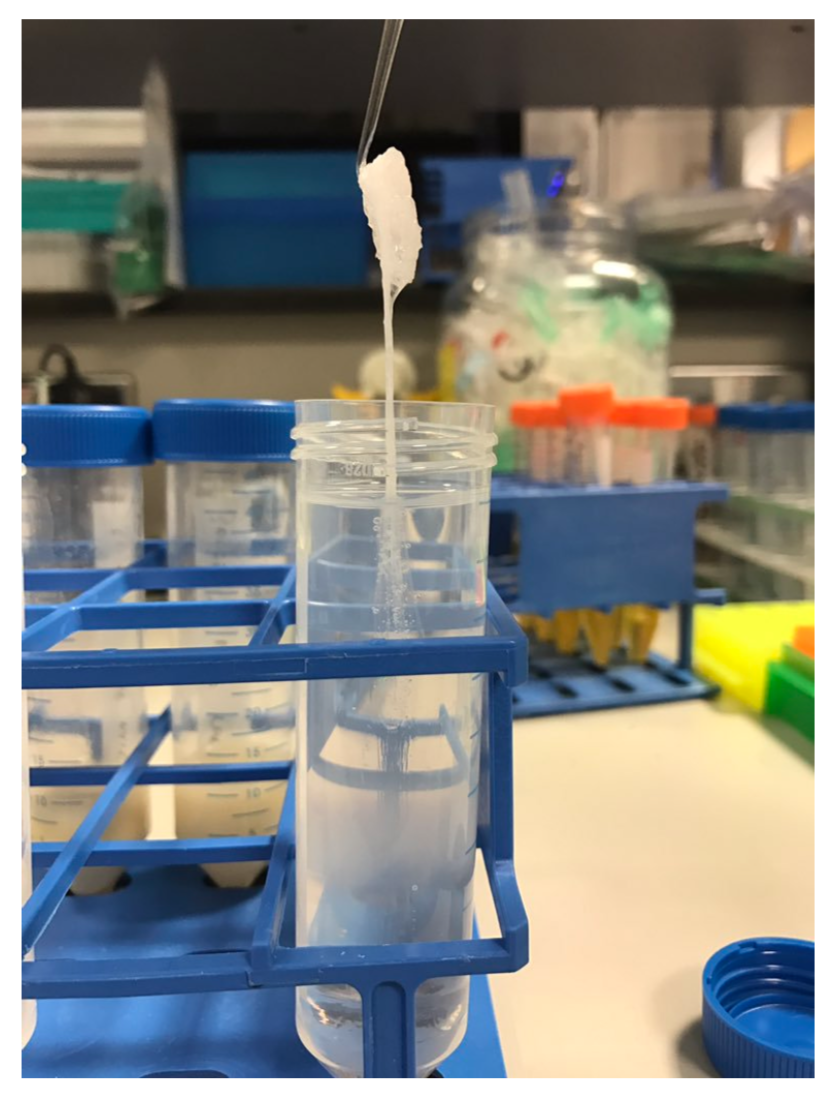
Figure 3. DNA prepared using the phenol-chloroform method being hooked out of the using a glass rod.
Dialysis is a technique commonly used in protein purification but can also be used to remove impurities from DNA and is preferable to phenol-chloroform when isolating large DNA fragments due to even more gentle handling. In molecular biology, dialysis is a method for separating molecules by their rate of diffusion through a semi-permeable membrane. Ions in solution will diffuse from areas of high concentration (in the sample) to areas of low concentration (in the dialysis buffer) until equilibrium is reached but the larger DNA molecules cannot pass through the membrane so are retained. Dialysis is performed either by putting the sample inside dialysis tubing and submerging it in a large volume buffer or for smaller volumes, by pipetting the sample onto a membrane floating on the buffer so called ‘drop dialysis’[20]. A useful side effect of this method is that DNA becomes concentrated over time as water moves out of the sample due to gravity. If higher concentration is required the dialysis can be performed for longer.
Isolating megabase size DNA requires significantly more time and effort than other techniques. In order to keep DNA molecules intact they must be protected from hydrodynamic forces. This is achieved by embedding the cells in agarose blocks known as plugs[21]. The extraction procedure is then performed on the cells in situ by placing the plugs in lysis buffer, digestion buffer and wash buffer. DNA can be analysed by inserting the plugs directly into a gel for pulsed-field gel electrophoresis (PFGE) or released from the gel using agarase. Agarase cleaves agarose into smaller subunits which can no longer gel at room temperature. DNA released from agarose plugs requires further purification by dialysis but this may not result in sufficiently high concentrations to be used for nanopore sequencing. This method is therefore promising but requires further development.
One of the main impediments to generating ultra-long reads is having sufficient input material. If you are able to grow cells in culture then this less of a problem. However, if the sample is limited in quantity it may be pragmatic to consider another approach. The approximate number of cells required to generate ultra-long reads (15 g in our hands) are given below (for phenol-chloroform extractions).
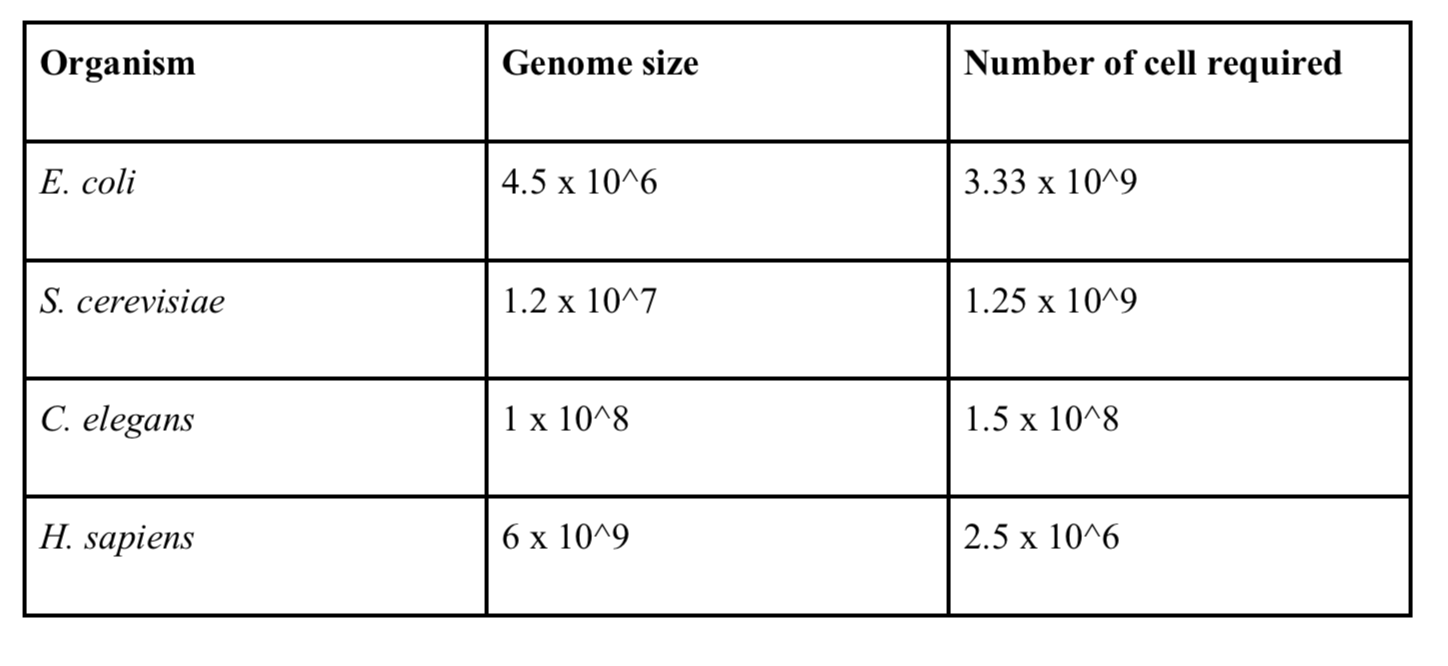
Table 1. Input requirements based on requiring minimum 15 g DNA for ultra-long library preparation.
Performing the appropriate QC on DNA extractions is vital to avoid disappointment when sequencing! The most commonly performed QC procedures are fragment size assessment, absorbance spectrometry and fluorometric quantification.
The TapeStation 2200 (Agilent) is a gel electrophoresis system used for fragment size assessment, although other instruments or conventional gel electrophoresis could also be used. One useful metric generated by the instrument analysis software is the DNA integrity number (DIN) which can be used to estimate the level of DNA degradation. A DNA sample with the majority of the DNA >60 Kb with little to no short fragments will have a DIN value of >9. If the sample shows a smear of short fragments, a sign of degradation it will have a DIN value <1. For all MinION library types a DIN value >9 is preferred. Lower values will result in more short reads. A 0.4x SPRI cleanup (see ‘Size selection with SPRI beads’) is able to remove fragments below 1500 bp. A better solution is to begin with high integrity DNA, then shearing down to the desired size, resulting in a tight fragment distribution with very few short fragments.
Another important metric for DNA quality assessment is the absorbance measured by a spectrophotometer such as the NanoDrop. This instrument measures the UV and visible light absorbance of the DNA sample which permits both quantification of DNA and of common impurities.
The commonly used absorbance ratios for assessing DNA purity are 260/280 (absorbance at 260 nm / 280 nm) and 260/230. The 260/280 ratio is generally 1.8 for pure DNA. A lower value could indicate protein, phenol or guanidine hydrochloride contamination. The 260/230 ratio is a secondary metric and is generally 2-2.2 for pure DNA. A lower value may indicate phenol contamination. However, correct interpretation depends on the extraction method: if you have used a spin column extraction kit guanidine hydrochloride would be the most likely contaminant whereas if you have done a phenol-chloroform extraction then SDS or phenol contamination are more likely. Changes in sample pH can also affect 260/280 ratios, so the instrument should be blanked using the same buffer than the DNA is in before use. Each nucleotide has different absorption so the composition of the DNA will affect the 260/280 ratio, AT rich samples will have slightly higher 260/280 ratios than GC rich samples.
\
Checking that absorbance ratios are consistent with pure DNA is an important QC step prior to nanopore sequencing. If there is a problem at this stage it is best to repeat the DNA extraction to confirm that the ratios are repeatable. We have had excellent sequencing results with the DNA in Figure 3, which has higher ratios than expected for pure DNA. Nanodrop is mainly useful for DNA purity assessment but less so for quantification as absorbance is less accurate than fluorometry.
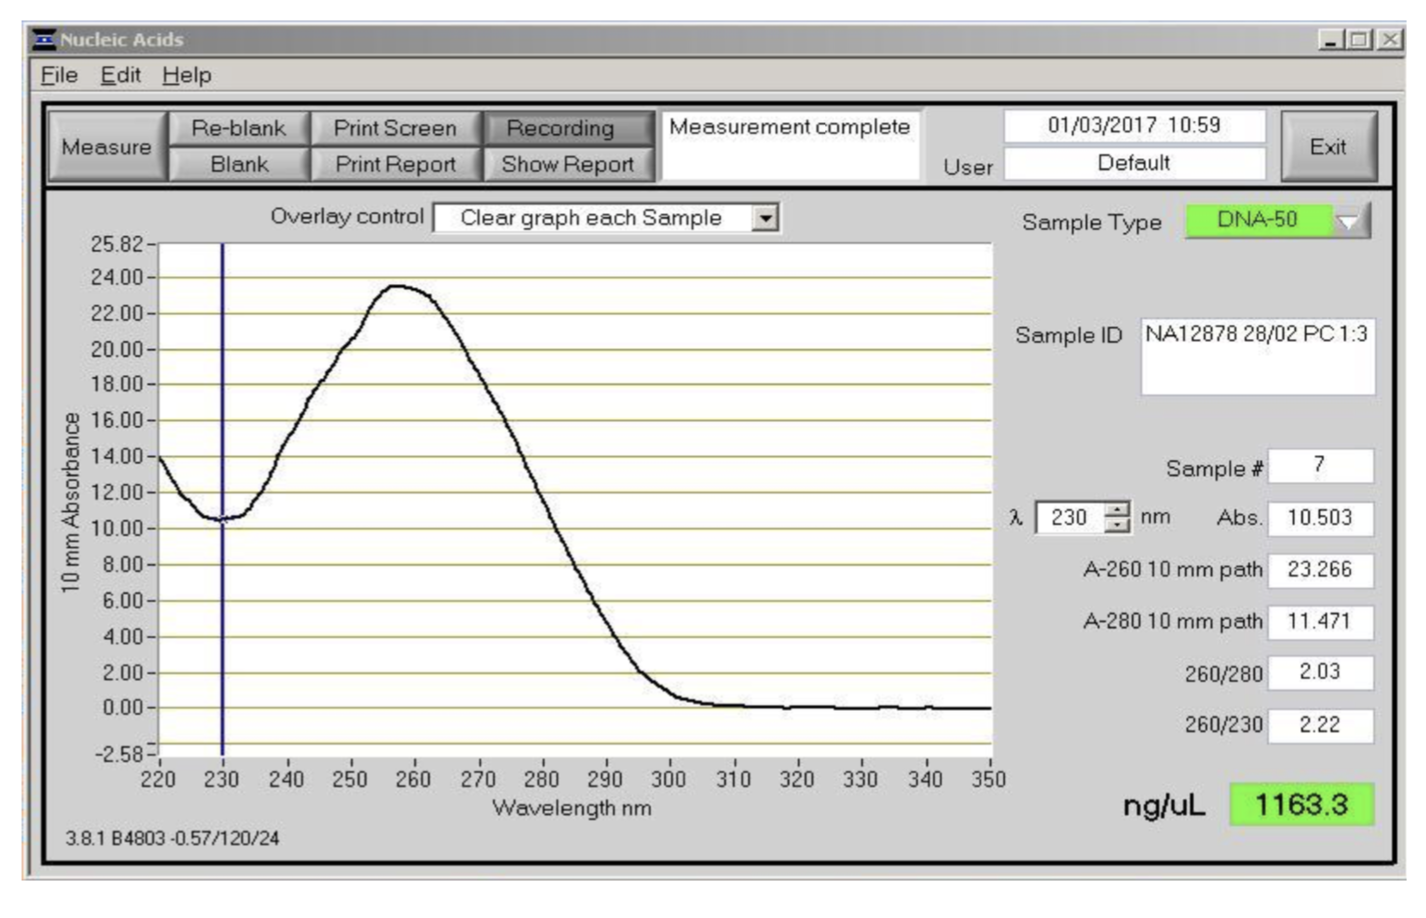
Figure 4. Absorbance spectra between 220 and 350 nm as measured by the NanoDrop instrument. This was the DNA sample used to generate the ultra-long reads for the MinION human genome sequencing project. It was extracted from the NA12878 cell line using the phenol method.
Fluorescence spectroscopy is an important technique for DNA quantification. It relies on the fact that nucleic acid stains such as SYBR Green I fluoresce when intercalated in DNA. It is excited by blue light and re-emits green light of a longer wavelength. The level of fluorescence is proportional to DNA concentration which can be extrapolated from the fluorescence level of standards of known concentration. The Qubit (Life Technologies) is a convenient fluorescence spectrophotometer for single samples and different kits are available for different sample types and concentration ranges. The most useful for preparing nanopore libraries is the dsDNA HS Assay (Life Technologies) which measures concentrations between 0.01 - 100 ng/µl.
DNA extractions with evidence of short fragments can be improved by performing size selection. A commonly used technique is the use of solid-phase reversible immobilization beads (SPRI). DNA binds to the beads in the presence of the bead buffer which contains a crowding agent, PEG (polyethylene glycol) and high concentration of sodium chloride. In these conditions, the DNA transitions from solution to a condensed ‘ball-like’ state in which it is attracted to the beads[10]. Size selection is controlled by altering the bead to sample volume ratio, with ratios of between 0.4x and 1.8x commonly used. SPRI is an easy way of achieving removal of short fragments but is only effective up to around 1500 base pairs at the lowest ratio of 0.4x.
SPRI beads can be used to clean-up DNA prior to library preparation. This makes them useful for reworking DNA samples that have failed quality control e.g. by absorbance spectra or fragment distribution. If the absorbance spectra suggest salt contamination you might decide to do a 1x SPRI clean-up to remove the salt. A final example is if you wish to buffer exchange a sample into EB. Many extraction kits will use Tris-EDTA (TE) as elution buffer which contains 0.1 or 1 mM EDTA to protect DNA against nuclease activity. It does this by sequestering metal ions from solutions which could be used as cofactors by nuclease enzymes. However, if the concentration is too high it will also inhibit the transposase enzyme used for library preparation. If you do not know or suspect a DNA sample is in the wrong buffer you can use a 1.0x SPRI clean-up to buffer exchange the sample into EB.
Agarose gel electrophoresis is used to separate DNA fragments by size[22]. As DNA is negatively charged it migrates towards the anode when exposed to an electric field. Typical gels are made with 0.5 – 2.0% (w/v) agarose with lower percentage gels giving better resolution for long fragments as they have a larger pore size. However, low concentration agarose gels are very fragile and HMW (high molecular weight) DNA cannot be resolved with all sizes moving together. PFGE on the other hand can separate fragments up to 10 Mb using a field which changes direction forcing the DNA to migrate through the gel in a zigzag motion. The size separation ability of long fragments by PFGE is exploited by instruments such as BluePippin and SageHLS to perform size selection of genomic DNA. The most useful mode for nanopore sequencing is selecting the longest fragments in a DNA sample after g-TUBE or needle shearing, known as a high-pass size selection. Up to four samples to be size selected at once with the BluePippin agarose cassette with the fifth lane used for the ladder. The DNA migrates through the gel by PFGE until the shorter, unwanted fragments have run past the collection channel. At this point the anode is switched so the remaining fragments are electroeluted into buffer in the collection chamber. The point at which to switch is determined by the ladder running past a detector beneath the cartridge.
When sequenced read length do not match the known size distribution DNA damage may be to blame. A common source of damage are single-stranded nicks. These are breaks in the DNA where there is no phosphodiester bond between two adjacent bases in the strand. These occur due to enzymatic activity or chemical damage to the DNA molecule. As the DNA strand is sequenced any nicks in the DNA will cause a premature termination of the sequencing read as there is no second strand to stabilise the nicked strand. Single strand nicks will not be detected by standard gel electrophoresis but can be detected on a formamide denaturing gel.
Single-strand breaks can be repaired using repair mixtures such as PreCR Repair Mix or FFPE DNA Repair Mix (New England Biosciences). These enzyme cocktails are designed to repair a variety of DNA damage, as well as single-strand breaks that can reduce sequencing errors and improve read lengths especially for old or damaged DNA samples. As an extreme example, ancient DNA (hundreds or thousands of years old) will contain an excess of abasic sites, deaminated cytosine, oxidized bases and nicks all of which should be reduced by FFPE DNA Repair Mix.
After expending so much care and love on a high molecular weight extraction, a little extra care should be taken to ensure that good work is not undone during storage. HMW DNA should be resuspended in elution buffer (EB; 10 mM Tris-HCl pH 8.0) or Tris-EDTA buffer (TE; 10 mM Tris-HCl pH 8.0, 1 mM EDTA). TE will provide protection against nuclease activity by chelating any Mg2+ ions but may be incompatible with downstream enzymatic reactions. Both will keep the pH at 8.0 which is optimal for DNA storage as nucleases are less active at this pH. DNA should always be stored in the fridge at 5°C as freezing will result in physical shearing[23]. We have found DNA is stable for a year or more at this temperature if free from nucleases.
DNA is a rigid molecule due to the electrostatic repulsion between negatively charged phosphates[24]. This makes it vulnerable to double strand breaks due to the hydrodynamic forces in moving fluids e.g. when pipetting. These forces can be minimised by pouring when possible, rather than pipetting and stirring when mixing. Maintaining high concentrations may help to reduce shearing as high concentration of DNA are more viscous. Keeping DNA in a condensed form by adding PEG or polyamines such as spermidine also reduces the likelihood of shearing
What if you could sequence E. coli in just one read? This was the challenge I set Josh. And why can’t we do that, if nanopore sequencing really has no read length limit?
Well actually: we’re not quite there yet, but we did manage to sequence 1/6th of the whole genome in a single read last week. Here’s how we (well, he) did it. As usual we like to release our protocols openly and early to encourage the community to test and improve them. Please let us know about any tweaks you find helpful! The community seems very excited by this judging by my Twitter feed and email inbox, so we have rush released the protocol. The tweets have also inspired commentaries by Keith Robison and James Hadfield, thanks guys!
Not bad .. 92% genome coverage of E. coli, average depth of 3.8x. But from just _43_ reads. https://t.co/vDqaEJblP9 (gt350kb.fasta) pic.twitter.com/x66o0lXayz
— Nick Loman (@pathogenomenick) March 2, 2017
First … a bit of background and the importance of working with moles not mass. This line of thinking was triggered during the Zika sequencing project when we noticed our yields when sequencing amplicons was never as good as with genomic DNA. Why was that?
We decided a possible reason is that nanopore sequencing protocols are usually expressed in terms of starting mass (typically 1 microgram for the ligation protocols). But of course 1 microgram of 300 bp fragments is a lot more (>25x more) DNA fragments compared to 1 microgram of 8000 base fragments. By not factoring this in the library prep, likely we were not making an efficient library because the protocol has not been scaled up 25 times to account for this difference. It stands to reason that it’s the molarity that’s important when loading the flowcell rather than the total volume of DNA. If you could load some imaginary molecule of DNA with mass 1000ng (bear with me), the chances of that interacting with the pore is still quite low. More molecules means more potential interactions with the pore, meaning more potential yield.
We calculated the desired starting molarity as 0.2 pM based on the length assumptions in the ONT protocol (in practice you load about 40% less after losses from library construction). So by increasing the amount of barcodes and adaptors, as we do in our Zika protocol, we can compensate for this.
That solves the short read problem, but we started thinking about how it would work in the other direction. What if you wanted to get the longest reads possible, what would this mean in mass? The rather silly idea was — if you wanted to get reads sufficiently long to cover a whole bacterial chromosome in a single read, what would the starting DNA concentration need to be?
The math here is simple; you just need to scale the starting DNA by 500x. But this would mean starting with ~500ug of DNA into the library preparation!
500ug of DNA is… quite a lot. And practically there are several problems with this idea:
So - we slightly scaled down our ambitions and decided that it could be practical to scale up the protocol 10-fold, which could still result in average 80 kb reads, a significant improvement to the 8kb typically seen with the standard protocol.
We’d already been using the Sambrook protocol (from the classic Molecular Cloning - over 173,000 citations!) for our human genome extractions, which reliably gives very high molecular weight DNA that can be recovered with a Shepherd’s crook fashioned from a glass rod). Previously Dominik Handler demonstrated that HMW extractions with careful pipetting could generate long reads with the rapid kit. So we did a new Sambrook extraction using an overnight culture of E. coli K-12 MG1655 and generated something that was very pure (260:280 of 2.0) and very high molecular weight (>60kb by TapeStation - the limit of the instrument). In fact the DNA is so long that you can’t really size it without employing a pulse-field gel electrophoresis setup. Sadly we don’t have a working one in the department, so infrequently are they used these days. So we were flying blind in terms of the true length of the fragments.
Scaling up the rapid kit was relatively straight-forward when dealing with inputs up to 2 ug. You get DNA at a concentration of 250 ng/ul then add the maximum 7.5 ul. However to get inputs of 10 ug it requires concentrations of 1 ug/ul where things start to get tricky. The library is so viscous loading beads start to clump together and it becomes harder to get the library through the SpotON port on the flowcell. Not satisfied with 10 ug either we pushed on towards 20 ug which required making a double volume library and adjusting the dilution downstream. We eventually settled on a protocol which could reliably give read N50’s over 100 Kb (i.e. half of the dataset in reads of 100 Kb of length or greater) with a tail stretching out to 500 Kb, or sometimes beyond…
The final piece of the puzzle was something we were aware of; the nanopore control software as of version 1.3 does periodic ‘global voltage flicks’ - meaning that the voltage is reversed across the flow cell every 10 minutes. The aim of this is to prevent strands or proteins blocking up the pores, by a rapid change of the direction of the ionic current. However, the problem with a 10 minute flicking interval is that it intrinsically limits the longest read on the system to 150kb (with 250 base/s chemistry) and 270kb (with 450 base/s chemistry). In MinKNOW 1.3 you could change the script parameters (stored in a YAML file) to remove this flick, but in MinKNOW 1.4 luckily it has been dispensed with entirely in favour of a much smarter system that dynamically unblocks individual pores on demand.
So … how does it look after all that’s been done?
We ran E. coli K-12 MG1655 on a standard FLO-MIN106 (R9.4) flowcell.
Total bases: 5,014,576,373 (5Gb)
    Number of reads: 150,604
N50:  63,747
Mean: 33,296.44

Ewan Birney suggested this would be more interpretable as a log10 scale, and by golly he was right!

Wow! The longest 10 reads in this dataset are:
1113805 916705 790987 778219 771232 671130 646480 629747 614903 603565
!!!
But hold your horses. As Keith Robison likes to say, and Mark Akeson as well, it’s not a read unless it maps to a reference. Or as Sir Lord Alan Sugar might say, “squiggles are for vanity, basecalls are sanity, but alignments are reality”.
Are these reads actually real, then?
Just judging by the distribution it’s clear that this is not all spurious channel noise.
Let’s align all the reads…
This dataset poses a few challenges for aligners. BWA-MEM works, but is incredibly slow. It goes much faster if you split the read into 50kb chunks (e.g. with split.py) but this is a bit annoying.
I decided to use GraphMap, this has a few useful functions - it will try to make an end-to-end alignment and it also has a circular alignment mode, which is useful as we would expect many of these reads would cross the origin of replication at position 0.
Another problem! The SAM format will not convert to BAM successfully, so I’ve output using the BLAST -m5 format for ease of parsing. The SAM/BAM developers are working on this (CRAM is fine).
After a solid couple of days of alignment, here are the results:

So we lose a few of the really long reads here which are obviously noise (the 1Mb reads is just repetitive sequence and probably represents something stuck in a pore and the 900Kb read is not a full-length alignment), but otherwise there is an excellent correlation between the reads and alignments.
So, the longest alignments in the dataset are:
778217 771227 671129 646399 603564 559415 553029 494330 487836 470664
That’s theoretical 1x coverage of the 4.6Mb chromosome of E. coli in just the 7 longest reads !!
95.47% of the bases in the dataset map to the reference, and the mean alignment length is slightly higher at 34.7kb.
A few other notable things:
So we would like to claim at least four world records here!
Longest mappable DNA strand sequence **
Longest mappable DNA strand & complement sequence
Highest nanopore run N50 (not sure about other platforms?)
Highest nanopore run mean read length
(**) we’ve actually beaten that record already with another run, but a subject for another post
An interesting exercise for the reader is to figure out the minimum number of reads that can be taken from this dataset to produce a contiguous E. coli assembly! My first attempt found a set of 43 reads which covers 92% of the genome, but you can do better!
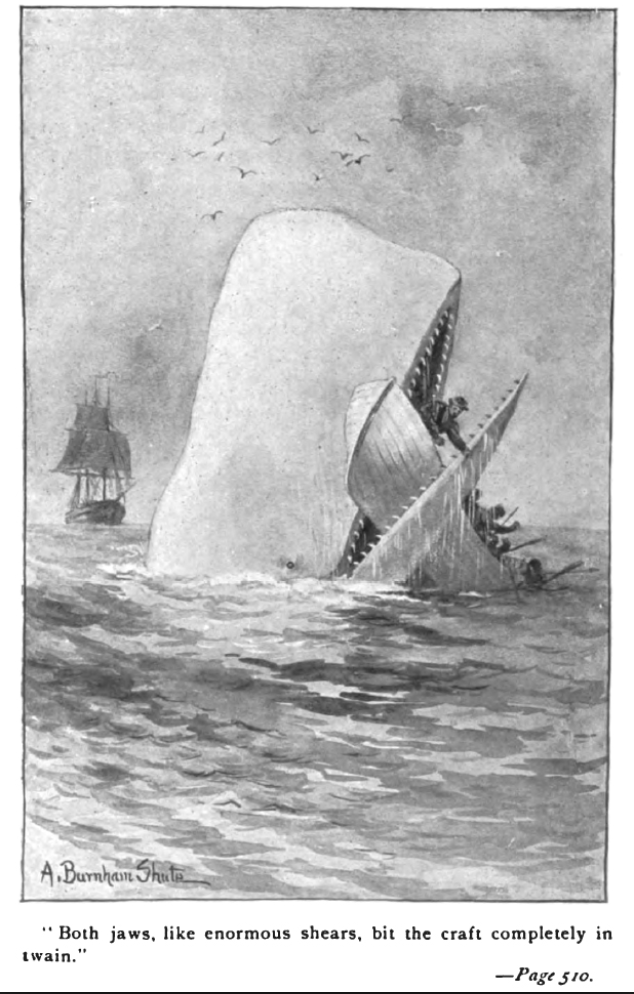
Where now? Well, readers will notice that a real landmark is in sight - the first megabase read. We’ve been running this protocol for a bit over a week and a new hobby is ‘whale spotting’ for the largest reads we can see.
We haven’t quite yet worked out a systematic naming scheme for whales, but perhaps Google has the answer.
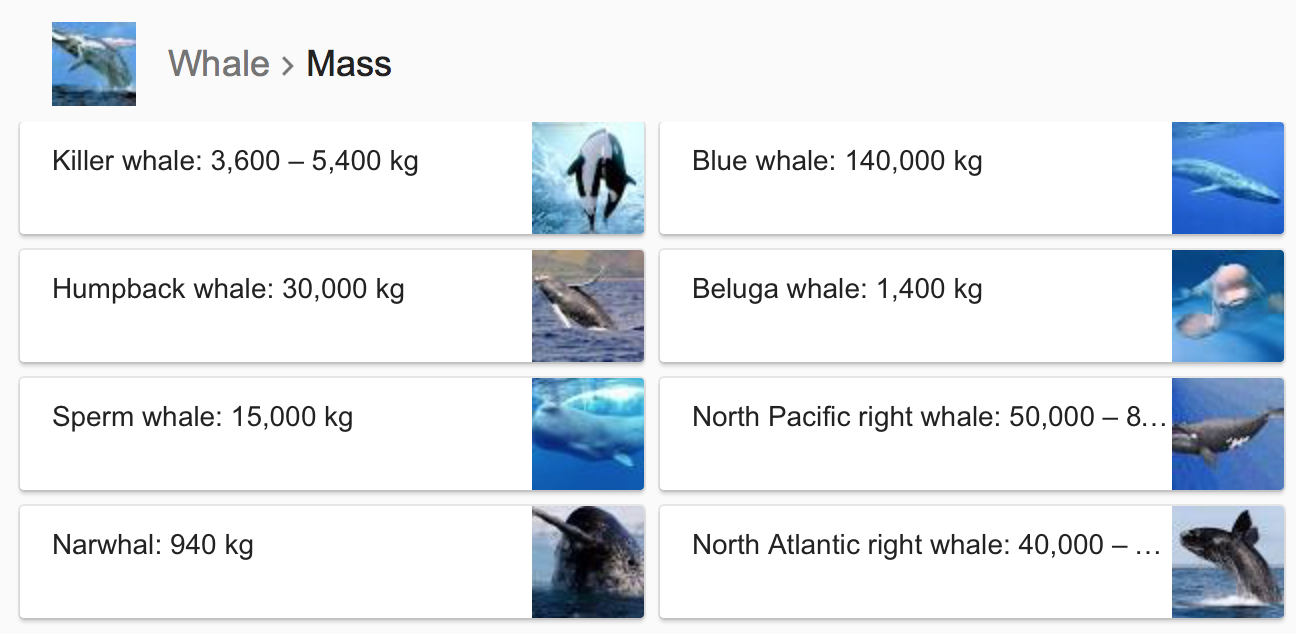
So in that case, we’ve in the past few days hit our first narwhal (an 882kb read from a different run, which translates to a 950kb fragment judged against the reference).
How can we go longer? Well it might be possible to increase the DNA input some more, but we start hitting issues with the viscosity which may start to prevent pipetting onto the flowcell. Also pipette shearing forces are presumably an issue at these concentrations.
The general consensus is that we will need to employ solid-phase DNA extractions and library construction, e.g. in agarose plugs. The SageHLS instrument also looks quite interesting.
Hosting courtesy of CLIMB:
The nanopore squad, John Tyson and Matt Loose provided much helpful advice and input during the development of this protocol. Matt Loose came up with the whale naming scheme.
Thanks to ONT for technical support with particular thanks to Clive Brown, Chris Wright, David Stoddart and Graham Hall for advice and information.
I have received an honorarium to speak at an Oxford Nanopore meeting, and travel and accommodation to attend London Calling 2015 and 2016. I have ongoing research collaborations with ONT although I am not financially compensated for this and hold no stocks, shares or options. ONT have supplied free-of-charge reagents as part of the MinION Access Programme and also generously supported our infectious disease surveillance projects with reagents.