Understanding insert size calculations from various software
20 Nov 2012Debugging some weird insert size distributions on recent MiSeq / Nextera sequencing runs which don’t seem to relate to the BioAnalyzer plots:
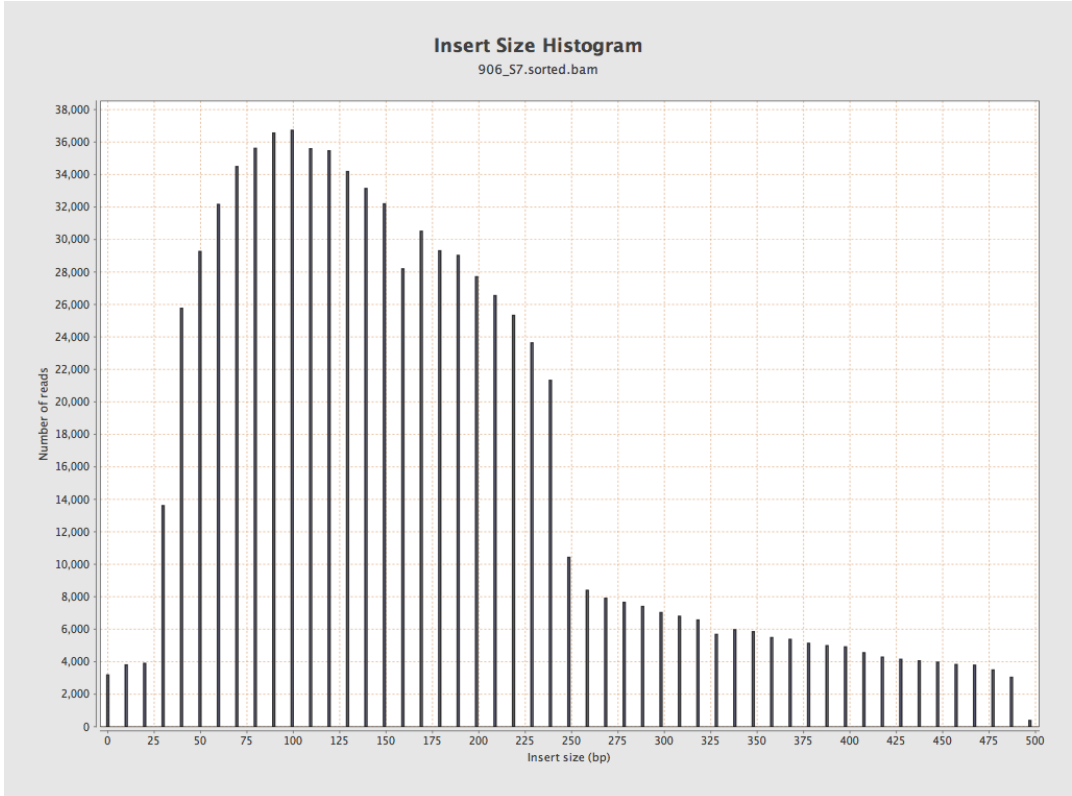
Mapped to reference with BWASW, image produced by Qualimap.
Two problems here;
- The distribution is properly weird (bimodal)
- The sequencing lab thinks the median insert size is 800bp from their BioAnalyzer plot
I’ve seen weirdness in insert size distributions before. From vague memories of online discussions I had a half-remembrance that not all aligners calculate insert sizes the same way, e.g. some report the distances between reads, and some report the total fragment length.
I would consider the correct definition of the insert size to be the total length of the original fragment put into sequencing. Therefore it would include the read length and the distance between fragments. This should be consistent with the definition of column 9 in the SAM format specification: http://samtools.sourceforge.net/SAM1.pdf
TLEN: signed observed Template LENgth. If all segments are mapped to the same reference, the unsigned observed template length equals the number of bases from the leftmost mapped base to the rightmost mapped base. The leftmost segment has a plus sign and the rightmost has a minus sign. The sign of segments in the middle is unde ned. It is set as 0 for single-segment template or when the information is unavailable
A quick test:
Extract 10kb of E. coli for test reference sequence
rsync -av rsync://ftp.ncbi.nlm.nih.gov/genomes/Bacteria/Escherichia_coli_O157_H7_EDL933_uid57831/NC_002655.fna .
python extractseq.py NC_002655.fna 10000 > ecoli_10k.fa
bwa index ecoli_10k.fa
bowtie2-build ecoli_10k.fa ecoli_10k.fa
Generate 500bp inserts, 100bp reads
Just a little script to pull out perfect reads from the reference file, with defined distance apart:
python extractpairs.py ecoli_10k.fa 500 100 1000 ec500
bwa bwasw ecoli_10k.fa ec500_1.fastq ec500_2.fastq
bowtie2 -I 0 -X 1000 -x ecoli_10k.fa -1 ec500_1.fastq -2 ec500_2.fastq
Result:
- Bowtie2 and BWASW both report 500, -500 for each pair as the insert size in the SAM output (column 9). As expected.
- Qualimap reports 500 as the insert size.
All as expected here. Perhaps the problem is with overlapping inserts?
Generate 300bp inserts, 250bp reads
python extractpairs.py ecoli_10k.fa 300 250 1000 ec300
bwa bwasw ecoli_10k.fa ec300_1.fastq ec300_2.fastq
bowtie2 -I 0 -X 1000 -x ecoli_10k.fa -1 ec300_1.fastq -2 ec300_2.fastq
Result:
- BWASW reports 300, 200 for each pair. This is clearly wrong. And Qualimap run on this output calls the insert size 250 as a result!
- Bowtie2 correctly reports 300, -300 for each pair.
Generate 200bp inserts, 150bp reads
- BWASW reports 100, 200 for each pair. Again, wrong. Is it calculating the insert length as 2 * read length - insert_size ??
- Bowtie2 correctly reports 200, -200
OK, so looks like BWASW might be the problem (0.6.2).
Let’s try BWA regular:
bwa aln ecoli_10k.fa ec300_1.fastq > ec300_1.aln
bwa aln ecoli_10k.fa ec300_2.fastq > ec300_2.aln
bwa sampe -a 1000 ecoli_10k.fa ec300_1.aln ec300_2.aln ec300_1.fastq ec300_2.fastq
- BWA in aln/samse correctly reports 200, -200
OK, so the first problem we know is the BWASW is reporting the insert sizes wrong. I will let Heng Li know.
But why are the BioAnalyzer plots still in such disagreement?
Let’s try again with Bowtie2.
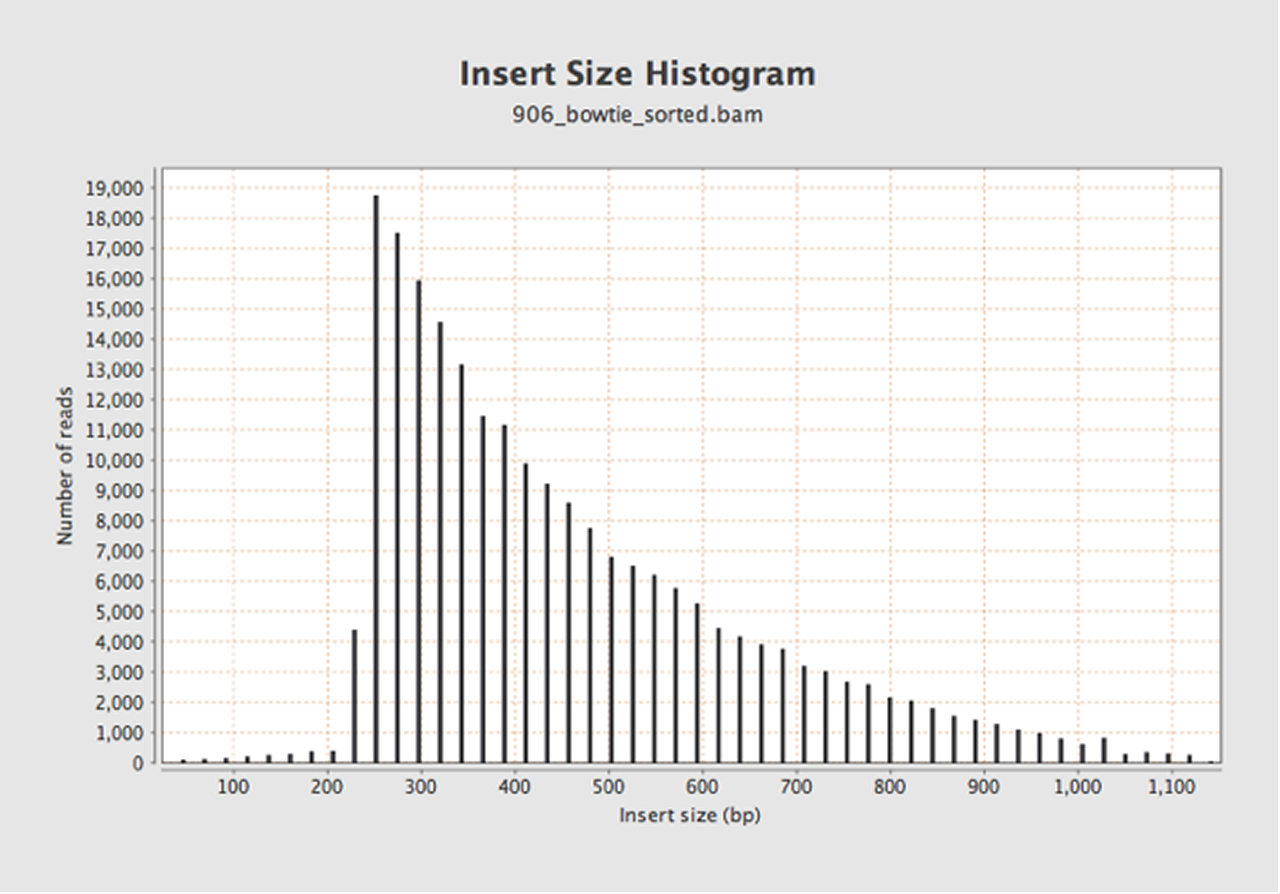
OK, maybe this makes a bit more sense now. But is the drop off at 250 bases real (due to correct clean-up), or an artifact of the read length?